Three Powerful Methods for Shell Meshing in Ansys: A Comparative Guide
Introduction
When working with surface body models in Ansys, the method you choose for connecting and meshing components can significantly impact your workflow efficiency and simulation accuracy. Whether you’re analyzing a motorcycle chassis, automotive frame, or any structural assembly, understanding the strengths and limitations of each meshing approach helps you select the right tool for your specific application.
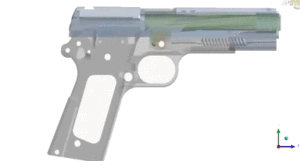
In this comprehensive guide, we explore three distinct methods for shell modeling and meshing using Ansys Discovery and Mechanical. Using a motorcycle chassis model as the example, each workflow is demonstrated step-by-step, revealing the unique advantages of each approach depending on your geometry, project requirements, and available tools. Our upcoming webinar will give you a live walkthrough for each method.
Quick Comparison Table
| Feature | Shared Topology | Connect Mesh | Weld Bodies |
| Automation Level | Medium-High | Highest | High |
| Geometry Prep Time | Low-Medium | Low | Medium |
| Handles Overlap | Manual workarounds | Manual workarounds | Automatic |
| Software Required | Discovery Standard | Discovery Standard | Discovery Premium |
| Parallel Meshing | No | Yes | Yes |
| Learning Curve | Base bodies only | Base bodies only | Independent weld materials |
| Best for | Geometric verification | Fast workflows | Complex assemblies |
| Video Step-by-Step Tutorial | Part 1 | Part 2 | Part 3 |
Quick Comparison Table
| Method 1: Shared Topology | Method 2: Connect Mesh | Method 3: Weld Bodies |
 |
 |
 |
| Extensions created and shared in Discovery | Extensions created and shared in Mechanical | Characterizing weld lines created in Discovery, Weld bodies created and shared in Mechanical. |
Method 1: Shared Topology with Surface Extension
Best for: Users familiar with CAD workflows who want complete geometric control and clean, predictable connections.
The Workflow
This geometry-level approach begins in Discovery’s Prepare tab by extracting mid-surfaces from the solid motorcycle chassis model. Using the Mid Surfaces tool:

With a range selection, the maximum thickness is set larger than the thickest component, and the extend surfaces option is enabled, which automatically extends surfaces to neighboring bodies—eliminating much of the manual work.

Sometimes, exceptions exist where manual intervention is needed. If there is bad geometry that prevents automatic extension, use the Pull tool to extend edges until they intersect the target body, followed by the Split Body tool to trim excess intersecting surfaces.

For overlapping components, a specific technique can be applied: using the Pull tool to extend edges up to surfaces, creating clean connections that will accept shared topology.

When to Use This Method
This approach excels when complete control over geometry is needed, and verification of all connections before meshing is desired. It’s particularly valuable for models where geometric relationships must be inspected and validated. However, it requires more hands-on work for complex geometries with problematic intersections, and overlapping bodies need attention.
Method 2: Connect Mesh Tool
Best for: Highly automated workflows where geometry preparation time needs to be minimized and parallel processing is beneficial.
The Workflow
This mesh-level approach simplifies geometry preparation. Mid-surfaces are still extracted in Discovery, but the extend surfaces option is disabled.

Each body is replaced with surfaces in the middle of parent bodies, but critically, nothing extends—the Connect tool handles extension during meshing.
After updating the geometry in Mechanical, the “Connect” mesh tool can be used by scoping all desired surface bodies and editing values of tolerance and size to produce mesh extensions.

Method 3: Weld Bodies
Best for: Models with numerous connections, particularly when different weld types are needed or specific materials must be assigned to connection regions.
The Workflow
This approach begins with mid-surface extraction in Discovery (again with extend surfaces disabled), then proceeds to the Assign Weld feature—which requires Discovery Premium.

Rather than manually selecting each edge in a model with many connections, the distance-based selection filter provides efficiency. The maximum distance is set greater than the largest gap to be connected. After box-selecting the entire model, bodies containing weld elements is highlighted in orange, while specific edges that will create weld line bodies are highlighted in purple.

Since the selection filter may capture unwanted edges, you can use the deselection tool to remove edges that shouldn’t become welds.

Once the selection is finalized and accepted, Discovery creates individual weld bodies highlighted in neon. Each weld exists in the tree as its own body.

Once the selection is finalized and accepted, Discovery creates individual weld bodies highlighted in neon. Each weld exists in the tree as its own body.
Once you’ve updated your geometry in Mechanical, the Weld Mesh tool provides precise control over weld generation. This specialized mesh control gives you flexibility to customize welds according to your simulation requirements.

The “Modeled As” option lets you choose how welds are represented—select Normal for perpendicular connections, Angled for non-perpendicular joints, or Normal and Angled when your model contains both types. You can assign specific materials to individual welds through the Material detail, ensuring accurate material properties in your simulation.
For single weld definitions, set Curve Scoping to “Body Selection” and pick the desired weld body from the available list. When you need to create multiple welds sharing identical settings, the worksheet function streamlines the process. Simply change the worksheet detail to “Yes” to open a blank worksheet, then click “Create Controls for All Curve Bodies” to automatically populate it with all available weld bodies.

After configuring your weld controls and generating the mesh, Mechanical creates each weld with shared nodes at the connection points between bodies, preparing your model for analysis.

Choosing Your Method
Based on the demonstrations, here’s when each method excels:
Use Shared Topology (Method 1) when:
- Verification of geometric relationships before meshing is needed
- Comfort with CAD workflows and hands-on control is preferred
- The model has relatively simple intersections
- Geometric accuracy and visual confirmation are critical
Use Connect Mesh Tool (Method 2) when:
- Geometry preparation time needs to be minimized
- Large assemblies can benefit from parallel meshing
- The model has problematic geometry but limited overlaps
- Quick iterations and time efficiency are priorities
Use Weld Bodies (Method 3) when:
- The model has numerous connections to manage
- Different weld types are needed (extension, fillet, or both)
- Overlapping components are present
- Weld properties differ from base material (for structural/fatigue analysis)
- The highest level of automation with maximum control is desired
Key Takeaways
Throughout these three methods:
- All methods eliminate manual contact definitions—shared nodes handle load transfer automatically
- Prime mesh integration (automatic in 2025 R2, manual selection in 2024 R1+) provides fast, high-quality quadrilateral elements for all approaches
- Geometry complexity matters—Methods 2 and 3 handle problem geometry progressively better than Method 1
- Overlapping components are the differentiator—only Method 3 handles these automatically
- Validation is consistent—”Color by Body Connection” confirms successful shared nodes across all methods
Conclusion
These comprehensive demonstrations reveal that modern simulation workflows offer flexibility to match meshing approaches to specific project needs. Whether choosing the geometric control of Shared Topology, the efficient automation of the Connect Mesh Tool, or the sophisticated capabilities of Weld Bodies, each method provides a pathway to accurate, efficient shell modeling in Ansys.
At DRD Technology, our team helps engineering teams master these workflows through hands-on Ansys training, technical support, and consulting services. Whether new to surface modeling or optimizing established processes, we can guide you toward the most efficient approach for your applications.
Ready to streamline your meshing workflows? Contact DRD Technology to learn more about Ansys Discovery and Mechanical capabilities or explore our upcoming webinar on advanced meshing techniques. Register for our upcoming webinar discussing the three methods!
")


")
")


")